Now that we are past Memorial day in an election year, all eyes are on the upcoming election. We get a lot of questions as to what the market usually does in election years. I thought it would be helpful to share some information on what we should expect.
- Macro/Pre-Election: Policymakers Will Keep Liquidity/Stimulus Flowing In 2024
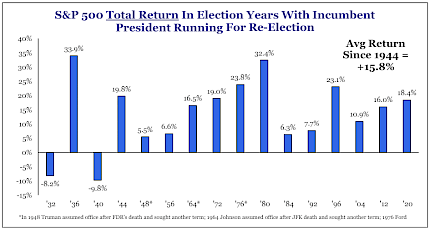
- S&P 500 has increased in every presidential reelection year since 1944 as sitting presidents stimulate the economy ahead of their reelection. Average return is 16% annually.
- Biden is willing to use the tools available to him more than other presidents as he sees this race as Biden vs the end of democracy.
- For example, Biden is ignoring the Supreme Court and has distributed more than $100bn of student loan forgiveness in tranches.
- If oil prices rise, Biden will use the Strategic Petroleum Reserve to keep oil prices low.
- $100bn of infrastructure spending being unleashed through IIJA, CHIPs, and IRA in 2024 FHFA is likely to approve a plan in June allowing Freddie Mac to purchase second liens.
- More than 1 million applications for the Employee Retention Tax Credit are sitting at the IRS which the IRS is legally obligated to pay. This adds another layer of consumer stimulus that can be distributed in the second half of the year.
- The Federal Reserve will slow the pace of its balance sheet contraction starting in June.
- June is a smaller hiccup compared to April, and once June clears out, we expect liquidity to flow through the election starting in July.
- We expect to see a large increase in T-bill issuance starting in July. Much of that issuance increase will be funded via money market funds parked in Reverse Repos. As money comes out of the RRP and into the Treasury market, liquidity increases, all else being equal.
- Liquidity through the Treasury General Account and Reverse Repos is highly correlated to the US dollar, 10-year yields, and corporate bonds.
- We see more risk in 2025 than 2024 as the hangover from this easing, the stickiness of inflation, and the fiscal cliffs comes to fruition.
Source: Strategas
Chart reflects price changes, not total return. Because it does not include dividends or splits, it should not be used to benchmark performance of specific investments. Data provided by Refinitiv.
Sincerely,
Fortem Financial
(760) 206-8500
team@fortemfin.com
Latest News
Wall Street ushers in new era of faster trade settlement
U.S. trading moved to a shorter settlement on Tuesday, which regulators hope will reduce risk and improve efficiency in the world's largest financial market but may temporarily lead to a rise in transaction failure for investors.
Reuters
US Consumer Confidence Recovers; Inflation Worries Persist
US News is a recognized leader in college, grad school, hospital, mutual fund, and car rankings. Track elected officials, research health conditions, and find news you can use in politics, business, health, and education.
US News


