U.S. equities were lower last week (S&P 500 -2.4%) for the sixth straight week (the longest stretch in over ten years). During the midweek selloff, the S&P 500 hit the lowest point since March 2021 and the NASDAQ since November 2020. The bearish case for equities focused on monetary tightening, persistent inflation, China COVID lockdowns, recession fears, and extended valuations. The only positive sector for the week was consumer staples (+0.3%); the worst sectors were REITs (-3.9%) and financials (-3.5%).
1Q Revenue Growth Outpaces Earnings Growth
With the quarter more than 90% reported, we continue to see revenue growth coming in stronger than earnings growth for the aggregate index. This suggests costs will be a greater focus over the coming quarters as margins continue to get squeezed. If revenue growth were to slow, it will be more detrimental to company profits over the coming year. The profit outlook looks optimistic for a recessionary environment.

Surprise Ratio Jumps During 1Q
The S&P 500 surprise ratio is 7.4% which is well above the historical long-term average of 4.1%. The sector which saw the highest surprise ratio was Utilities at 15.1% with the industrials coming in with the lowest surprise at 2.6%. The revenue surprise ratio was just 2.8% with the Utilities and Energy sectors as the leaders at 8.8% and 7.9% respectively.

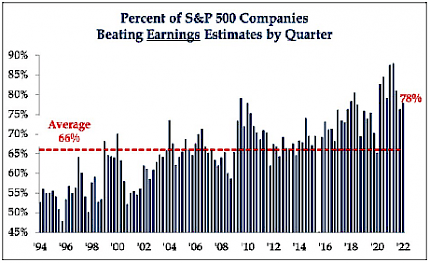
78% Of Companies Have Beaten Estimates This Quarter
Compared to the historical long-term average of 66%, the 78% of companies that beat estimates this quarter is high relative to history. However, compared to the post covid quarters it has normalized somewhat. On a sector basis, the industrials sector actually saw the greatest number of beats at 90% while discretionary saw the lowest reading at 56%.

Negative Guidance The Bigger Story This Earnings Season
According to FactSet, 76 companies in the index have issued EPS guidance for Q2 2022. Of these 76 companies, 53 have issued negative EPS guidance and 23 have issued positive EPS guidance. The percentage of companies issuing negative EPS guidance is 70%, which is above the 5-year average of 60% and above the 10-year average of 67%. With 19 negative pre-announcements for the technology sector, one wonders if companies are simply taking their medicine and lowering the bar for future quarters with the overall sector down big.

Source: Strategas

Chart reflects price changes, not total return. Because it does not include dividends or splits, it should not be used to benchmark performance of specific investments. Data provided by Refinitiv.
Sincerely,
Fortem Financial
(760) 206-8500
team@fortemfin.com
Latest News
Ben Bernanke Sees 'Stagflation' Ahead
The former chairman of the Federal Reserve has a new book out on Tuesday explaining the powers of the Fed and Congress to juice or slow our economy amid a supply-chain crunch and sky-high...
The New York Times
Fed's Williams Says Bond Market Functioning Well in Uncer...
New York Fed chief reiterates the central bank is moving aggressively to lower inflation and he expects that inflation will moderate next year.
The Wall Street Journal
Fed's Powell to Take WSJ Questions on Inflation and Econo...
Central bank officials have firmed up expectations for a series of half-point rate increases this spring and summer.
The Wall Street Journal
