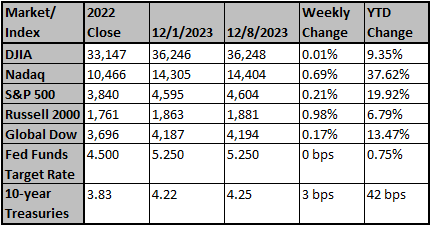
Lately, there has been much discussion about how soon the Fed will have to cut rates as many believe they are too restrictive. While we are cautious about the ultimate message rates have for equities, we are even more concerned about how little balance sheet runoff is discussed in the context of cuts. If we look back to 2019, the last time the Fed began cutting rates during balance sheet runoff, the runoff lasted just a few more weeks before the Fed ultimately had to reverse course due to repo market strains.
Worst Relative Year For The Average Stock Since 1998
We’ve covered the narrow market leadership that’s been observed in our work extensively throughout the year but thought it may be important to provide context for just how tough it has been for the average stock. Using the S&P 500 equal weight index as a proxy for the average stock, this has been the worst relative performance year to the cap weighted index since 1998. It should be noted that the equal weight index underperformed handedly again after this in 1999 but then went on to outperform the cap weighted index for almost the entirety of the 2000s.
Modest Outperformance From The Average Stock Recently Should Help Active…
With narrow performance, predominately domiciled within the Magnificent 7, active managers have had a tough run in 2023. The S&P 500 equal weighted index has underperformed the market cap weighted index by roughly 1200 bps. On a positive note, the average stock has made up some ground since mid-November on a relative basis, roughly +300 bps, which should aid active managers who have fallen behind their benchmarks.
…But A Tough Year Overall For Active Given The Concentration In The Market
Last year active managers did significantly better based on the data we track but this year they have reverted back to the percentage of outperformance seen during the Q.E. era. At 23.9% of large cap core active managers outperforming, it speaks to the challenges managers face when such a large portion of the index returns is attributed to just a few stocks. One has to go back to the late 1990’s for a comparable period to when the market weighted and equal-weighted index differed so significantly.
Source: Strategas
Chart reflects price changes, not total return. Because it does not include dividends or splits, it should not be used to benchmark performance of specific investments. Data provided by Refinitiv.
Sincerely,
Fortem Financial
(760) 206-8500
team@fortemfin.com
Latest News
Powell may hope for replay of Fed circa 1995 even as he shuns "victory"
As victory celebrations go, the Federal Reserve's announcement of a quarter point interest rate cut in July of 1995 was hardly ostentatious.
Reuters
Wall Street hopes for relief on Treasury dealer rule after pushback
Asset managers, insurers and pension funds are pushing to soften a proposed rule aimed at enhancing U.S. Treasury market stability which could require them to register as broker dealers, subjecting them to tougher rules, industry sources and documents show.
Reuters


